DazShift is a tool to analyze a data series, typically returns, for fundamental shifts in the levels of averages or dispersions. It allows a chief investment officer or an investor to monitor the stability of the investment process.
Premise
The premise is very simple:
- Investment returns experience continuous fluctuations
- Can this variation be distinguished into a regime, which may vary over time but persists for periods, versus noise?
- Such regime shifts might indicate changed market dynamics, an intentional change in the investment process or an unintended change in the investment process
- Early identification of a potential regime shift in an investment product, combined with confidence measures of such a shift, can alert a chief investment officer or an investor
Regime Shift Analysis
Regime shift analysis is inherently complex and requires well-informed judgment to define and to interpret.
DazShift includes several features that make this task easier:
- It supports regime shifts in averages and dispersions, typically of returns but also used with volumes, for example
- It provides a detailed toolkit of methods that can be applied to tailor an analysis to fit the specific data series
- Clear summary reports and low-level detail reports are provided to look into the process
- Three key criteria are reported to show the effectiveness of an analysis:
- The number of detected regimes – do you want fewer significant shifts or more granular shifts?
- Quantity, the average (or dispersion) of all the data versus the sum of the absolute shift values – has the analysis provided sufficient discrimination between shift periods?
- Quality, the time-weighted ex post confidence level of all shifts – do you want a higher or lower statistical significance for the analysis?
- The ability to save all your parameters and method configurations into simple re-usable Profiles
Examples

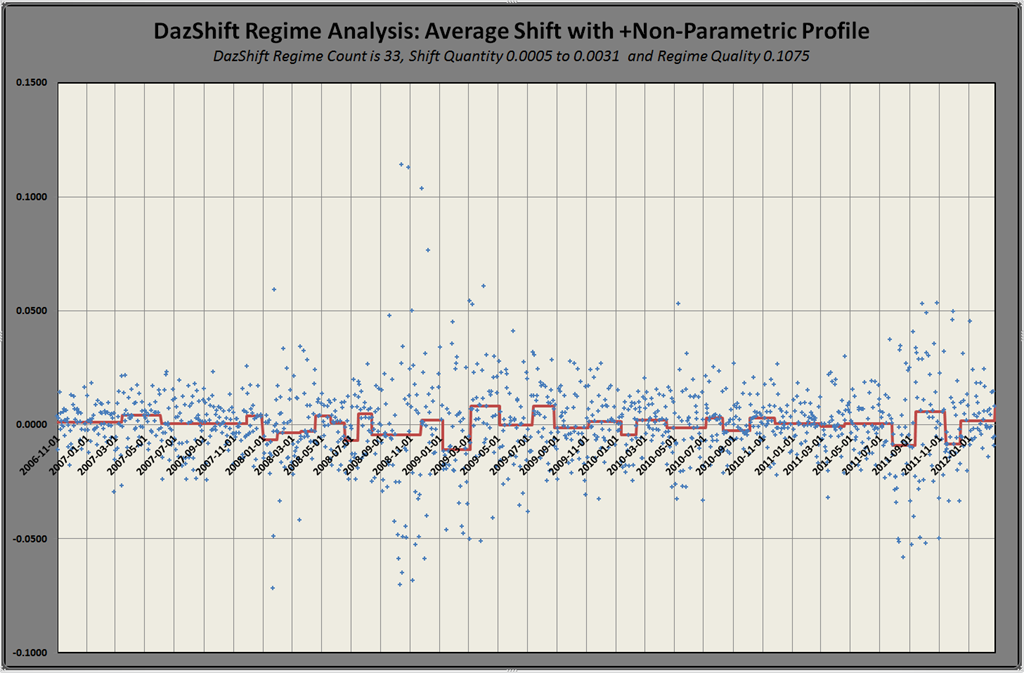
This example shows an analysis of the DAX index over 1,335 returns from 2006 to 2012.
The actual returns are shown by date and level as a scatter plot.
The regime shift analysis is superimposed over the scatter plot to show the regime shifts detected by the model. In this case the model is based on non-parametric methods as the underlying data does not conform well to conventional assumptions of a Normal distribution.
The resulting analysis discriminated 33 different regimes with weighted sum of the absolute regime values of 31 basis points – a six-fold improvement over the median market return of 5 basis points. The weighted average confidence level for all regime shifts was 0.1075, not statistically significant at the 0.05 level but interesting none the less.
![DazShift 02_thumb[1]](http://dazrisk.com/wp-content/uploads/2012/03/DazShift-02_thumb1.png "DazShift 02_thumb[1]")
Here is an example for Apple showing 15 regime shifts with a return of 40 basis points compared to the market return of 17 basis points. It shows what we already know: there is a persistent regime bias toward gains in the price of Apple, with two corrections during the financial crisis.
![DazShift 03_thumb[1]](http://dazrisk.com/wp-content/uploads/2012/03/DazShift-03_thumb1.png "DazShift 03_thumb[1]")
On the other hand, here is the regime analysis for Apple’s daily trading volume.
Why this Matters
While some people want to apply regime shift analysis to predicting markets, my interest is in applying it to our investment processes.
Regime shift analysis can show when something has changed in the investment process to cause a change in the investment returns, above and beyond the continuous noise of daily variation. How often have you looked at a return series and wondered if something has changed or broken?
If you are a portfolio manager, a chief investment officer or an investor looking over multiple investments, DazShift can act as an early-warning indicator to flag those investment processes that seem to be changing.
- Are those changes intentional or unintentional?
- Does the portfolio manager know that the returns have shifted?
- Why wait six months before proof of a change is obvious or declared when DazShift can flag it quickly?