These Daz Toolkits are an evolving collection of analytical functions in Excel for the professional investment manager and financial analyst. They have been developed and used for many years in different organizations. They are all installed in Excel as add-ins so that their functions are included as an extension of the functionality of Excel. They are not compiled libraries but are implemented using Excel VBA macro language. You can read the exact processing to make sure that nothing unsafe is being installed and you can extend them to include your own variations of the functions.
Each individual Library includes the open Excel VBA add-in, documentation on each function and test-case spreadsheets proving the functions, including vertical and horizontal arrays. Purchases are made through PayPal – please contact Peter at DazRisk.com.
Why Tools?
Definition: Instruments used in a profession, e.g., tools of the trade.
Tools have been the helpers of craftsmen for millennia. Each craft has its own characteristic tools, and each craftsman has his/her own distinct preferences. The wrong tool is worthless. The right tool is invaluable. The hand knows which is which.
DazRisk provides several different Excel tools, and each is fit for a purpose – distinct and complementary to the others. They are designed for the craftsman analyst who knows his/her craft and wants granular control. The most commonly used tools are the three function libraries that provide Excel functions that you can use in exactly the same way as you could use any Excel function within your worksheets and formulas. The second set of Daz tools are also implemented in Excel as ‘applications’, which have their own application user interface to make them easier to use for more complex analysis. The data comes from Excel, the calculations are all done in Excel and the results are all placed and formatted in Excel.
Excel Function Toolkits
There are three core Daz toolkit add-ins for the analysis of market returns that share a common design theme and are the core capabilities of the DazAnalytics: DazStat, DazRatio, DazBeta.
- All of these analytics run inside Excel as user-defined functions: they appear to you exactly like Microsoft’s own Excel-provided functions
- Each add-in uses the same function parameters consistently across all functions in that add-in: you can easily change a single variable across all functions
- The functions within each module are determined by the first parameter (which can be set externally) so the analyst can quickly move between related results by changing only one switch
- Most functions can also return an array of related secondary results providing depth to the analysis
- Each toolkit can return all primary and secondary results as a single array so a whole array of all results can be seen, and changed, in one step
- The source data arrays may be arranged vertically or horizontally for your convenience
- The source returns may be provided in decimal (0.03) or percentage terms (3.0) for your convenience
- Leading and trailing zeroes are ignored in the source return arrays – critical when using a sparce matrix of data
- The Daz result arrays may be arranged vertically or horizontally
- Every function can return its own label so you will always no which array is using which function
- Data can be of any periodicity
DazStat is the fundamental collection containing 24 analytic functions and the ability to run them all as an array. Its focus is on the characteristics of the data distribution itself. In particular, DazStat emphasizes tests for randomness and conformity with the Normal distribution function. If the returns do not conform to the Normal distribution function, then most of the standard descriptive statistics used in conventional investment analysis will be invalid. DazStat provides a deep library of alternative non-parametric functions that are equivalent to the ‘standard’ parametric functions that were used before processing became cheap and powerful. Most market data do NOT have a stable parametric structure, so the DazStat library is absolutely essential for good analysis. DazStat is sold for USD 100.
DazRatio focuses on risk-adjusted performance measures and provides 14 analytic functions and the ability to run them all in an array. Different analysts have different preferences for these ratios so this toolkit provides many tools that may be compared, especially when run as an array. All these tools allow the analyst to specify a constant minimum acceptable return (MAR) to focus the results on excess return analysis. DazRatio is sold for USD 100.
DazBeta is the most complex toolkit and provides 18 independent analytic functions and the ability to run them all as an array of 59 results. These tools include both conventional and proprietary measures for the relationships between returns – such as correlation and Beta. In particular, DazBeta includes the proprietary Partial Natural Beta (see SSRN paper Partial Natural Beta: An Argument for a ‘Better’ Beta by Peter N.C. Davies :: SSRN). While DazRatio provides for a constant MAR (consistent with convention), DazBeta provides an alternative of specifying a time-varying return array as a dynamic MAR.
DazBeta also contains the proprietary non-parametric measurement of Coincidence. Coincidence is a value between -1 and +1 to measure the statistical significance of extreme events – therefore low number of observations. It was created to show that a pure quantitative manager running a market neutral overlay program was, in fact, not neutral to extreme events, despite all their assurances and quantitative validations. Coincidence proved statistically that, in the real world, the manager’s models were all (grounded on ‘normal’ market movement) but extreme market movements did not behave in the same way at all – to the great detriment of investors. DazBeta is sold for USD 100.
DazBetaMatrix is designed to facilitate non-parametric measures associated with Beta. Beta is a very useful in asset management because it is widely understood to represent an asset’s risk relative to a common market index or benchmark. Unfortunately, like many other common analytics, it is unfit for its purpose when applied to financial market returns, which are subject to both runs and regime shifts (see above). DazBeta provides a robust non-parametric alternative and the DazBetaMatrix application integrates DazBeta with matrix processing to allow multiple assets to be assessed against multiple indices under the control of a consistent set of rules, determined by you. It is an essential tool for quantifying a ‘better’ Beta consistently across assets and indices in a single process.
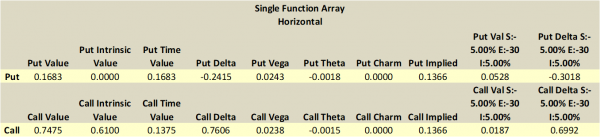
DazOptions provides complete support for both American (Cox, Rubinstein and Ross) and European (Black-Scholes) option types, puts and calls, including all secondary derivatives. The matrix processing makes it very easy for pricing and determining the non-parametric derivatives of price for an option position or book. You can give a price and get back the implied volatility or vice-versa. You can also feed external changes to the spot price value, implied volatility value and expiration date to create an array of values. DazOptions is sold for USD 50.
DazTools is a powerful package of data manipulation tools that allow you to better manage the price and return data sets you want to analyze by creating new data arrays from your raw data for further analysis, based on rules you determine. The new arrays can be created using many different rules: up, down and neutral return series; up, down or neutral excess returns over a benchmark series; non-overlapping runups and rundowns (determined by a specified window size) and neutral events in the passive benchmark series; the creation of new series of +1, 0 and -1 values for non-parametric analysis. DazTools is sold for USD 50.
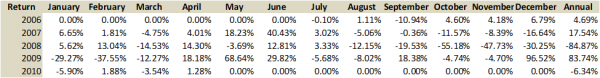
DazTools also includes functions to fold a linear, daily return data series into an array of monthly returns by year, with cumulative annual returns added. There is an equivalent function that takes a table array of monthly returns and creates the linear series, excluding the annual returns. We go back and forth between these different return styles all the time, depending on how the data is given to us or how we must present our data! Other functions can create aligned weekly or monthly return arrays from daily data series.
Excel Analytical Applications
These are the more complex Daz analytical tools that are more usable via a user interface rather than complex formula functions that are not easily readable. Think of them as applications, programmed in Excel VBA, implemented as add-in libraries and run from a user interface.
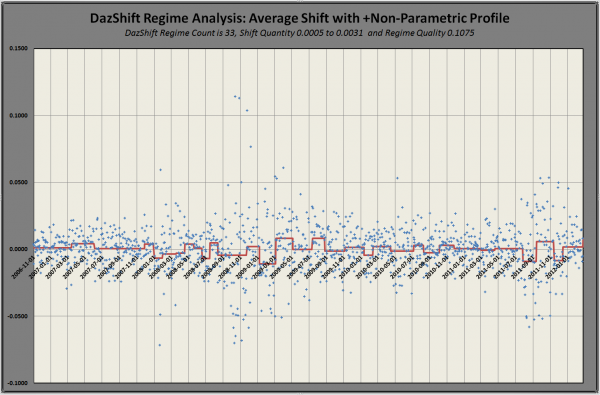
DazShift is a natural complement to the definition of risk as variability. In many cases a portfolio is constructed and managed with a longer-term horizon, regardless of tactical market volatility. DazShift is a sophisticated and highly configurable application that identifies regime shifts according to the parameterization that you define and using multiple models. You can monitor the portfolio (or assets) in both a graphical and tabular result, with DazShift identifying any statistically significant regime shifts and their effects on the portfolio. This is complicated stuff and comes from extensive research and engagement with researchers in both pharmaceutical quality management and climate change scientists! They also have to look at large amounts of data to identify when expected variation (noise) changes to indicate a shift in the underlying processes. Trading and investing are no different. DazShift is sold for USD 100.
DazUtility provides a simpler, interactive, user interface for data manipulations in six different ways for further analysis, with certain fields being activated depending on the transformation you want. DazUtility is sold for USD 50.
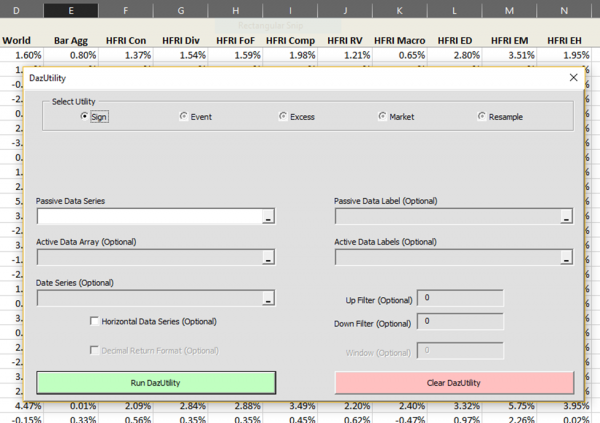
The creation of the result arrays can be based on the active data sign (+/-), the level of gain or loss, the excess gain or loss compared with a passive return series, or non-overlapping run-up and drawdowns. You can also use re-sampling of the original data for further analysis.