Coincidence is a proprietary measure of risk that I have developed and is included in DazBeta v3.2.
Premise
The premise is very simple:
- I want to know about the expected relationship between portfolio returns and market returns
- I want to know about the unexpected relationship between portfolio returns and market returns
- I do not want to assume that the two are the same
Pearson’s correlation is the most frequently used model for describing the relationship between returns. I have a proprietary implementation of correlation (Partial Natural Correlation) that I think addresses some of the vulnerabilities of correlation when applied to investment returns. Specifically, Partial Natural Correlation is a better measure of the inside systematic relationship that is expected between returns. What about the unexpected returns?
Coincidence is a description of the unsystematic relationship between returns under stressed market conditions. Specifically, it measures the clustering of extreme market returns with extreme portfolio returns, regardless of how those returns might be related on average, over time, as expected, etc. It is a direct measure of the relationship, if any, in extremis.
The development of Coincidence came about as I investigated a market-neutral equity long-short portfolio. All the positions were taken from the S&P 500 and the S&P 500 was the market index for the fund. This is a common enough strategy that it should produce few surprises since the model showed a Beta of zero and there are no non-linear or actively managed exposures. The problem only became evident when looking at the actual fund returns and observing that the fund performed worst when the S&P 500 index performed the worst: the fund had an ex post Beta that did not show up ex ante. Coincidence was the measure that captured the problem and measured its significance.
Coincidence
Coincidence is a simple and intuitive method for measuring the clustering of extreme market returns with extreme portfolio returns. It was designed to have the same properties as Pearson’s correlation for familiarity.
- It is not a measure of systematic tail risk: it does not depend on skew, kurtosis or other properties of distributions
- It is a non-parametric model that does not presume Normal distributions between the returns
- It is a value between –1 and +1. A Coincidence of 0 means that the market factor events have no clustering with the portfolio returns
- A Coincidence of +1 and -1 means that the market factor events cluster 100% with the portfolio returns of the same or opposite sign
- It can be tested for statistical significance producing a p-Value
Coincidence is best understood visually:

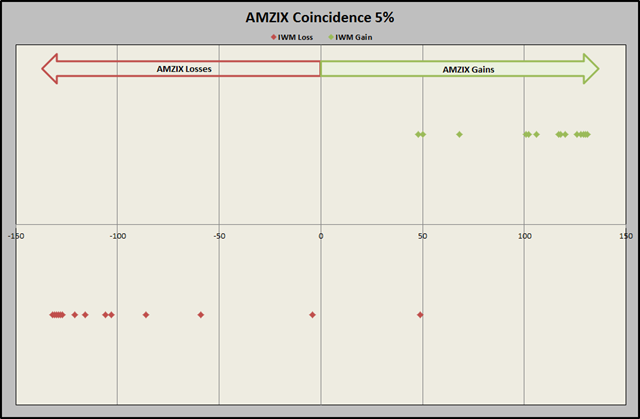
This is a plot of the 264 weekly returns of the AMZIX MLP portfolio for the period November 2004 to November 2009. The AMZIX returns are ranked from worst loss on the left to highest gain on the right. If the AMZIX portfolio were neutral to equity market indices (IWM in this example), we would expect to see extreme index events randomly distributed across the whole range of AMZIX returns. Instead, we can see that the 14 (5%) largest gains in the IWM index cluster with the AMZIX gains. Likewise, the 14 largest losses in the IWM index cluster with the AMZIX losses, though less tightly clustered. This clustering shows that extreme IWM gains and losses coincide with AMZIX gains and losses.

Above the line are the 1% (3 events) largest gains and losses in the IWM index. Regardless of how the AMZIX portfolio and the IWM behave on average, these plots show very clearly that in extreme market conditions the portfolio and index are aligned.
Using the DazBeta Coincidence function we can test for the Coincidence of gains and losses independently, as well as showing the statistical significance of the Coincidence measures.
Here are the Coincidence measures for a range of market indices relative to the AMZIX portfolio returns:

- VIX and TLT have a negative Coincidence with AMZIX while SPY, IWM and IYR have a positive coincidence
- SPY and IWM equity Coincidence are effectively symmetrical for gains and losses. IYR and TLT are slightly asymmetrical. VIX is strongly asymmetrical (-0.48 and –0.78)
- IYR is interesting as both REITs and MLP are “high-yield equity” assets so it is interesting to see that the Coincidence is lower with AMZIX than either the S&P 500 or Russell 200 equity indices. It is also interesting to note that the IYR gain Coincidence have insignificant p-Values while the loss Coincidence values are highly significant. This is an interesting result – it suggests that extreme gains in MLPs and REITs are in response to different factors while both asset classes are responding to the same factors during extreme losses, which could be a real problem for portfolios combining the two.
- In all cases the Coincidence is significantly higher than would be expected from the correlation – the Coincidence of TLT is approximately three times the correlation. This implies that extreme changes in longer term interest rates have a strong impact on MLPs while non-extreme changes do not have any significant effect. This is very important for hedging
- In all cases the Coincidence is higher than the Partial Natural Correlation at 5%
Why am I comparing Coincidence with Pearson’s correlation rather than with Beta? Beta includes the volatility or magnitude of the returns while correlation and Coincidence reflect the directional compatibility. TLT may have a lower magnitude of change than IWM, for example, but in both cases the biggest drops in the AMZIX occur at the same time as the biggest drops (IWM) and jumps (TLT). What hedge ratio should you use then? Easy: look at the magnitude of those biggest jumps in TLT relative to the biggest losses in AMZIX and that is the hedge ratio.
Why this Matters
We know that extreme market events have different relationships with portfolio returns than so-called normal markets. We have seen, repeatedly, that there is a contagion effect that can transfer risk across countries, markets and asset-classes. Why?
Normal markets are responding to the normal ebb and flow of incremental information. This incremental information falls within the range of expectations, particularly of sophisticated analysts, traders and investors. The market prices adjust, relative value spreads the impact across the markets in a gradual manner.
Extreme markets, especially in the last 20 years, are caused by a discontinuity in the information at the national and global levels, particularly policy changes with regard to debt (Russia), currency (Asia) and the regulation of financial intermediaries (USA). This information forces an abrupt change in expectations for the analysts, traders and investors who set the tone for the markets, freezes relative value behavior, and the markets respond in dramatic, and often exaggerated, ways.
The normal ebb and flow of market gains and losses is based on a different class of information than the stressed market gains and losses. In stressed markets all asset classes are responding to the same information. That will drive the clustering of returns that will be more exaggerated than expected from the relationship that exists in normal markets.
Coincidence is a unique measure for assessing the functional correlation between markets and portfolios under stressed conditions. Using correlation, we might believe that long TLT is a poor hedge for AMZIX losses (–0.30). That changes when we see that long TLT has a –0.71 Coincidence with AMZIX extreme losses and what could be a less expensive option hedge than using SPY, IWM or IYR.